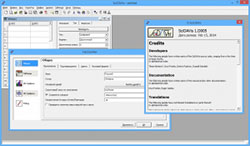
 SciDAVis is free software for scientific data analysis, visualization, and preparation for publication.
SciDAVis is distributed under the GNU General Public License.
SciDAVis has an easy-to-learn and intuitive interface with extensive capabilities, including the ability to write scripts and create custom software modules.
SciDAVis is a cross-platform application (Linux, Microsoft Windows, and Mac OS X) and can also be used on other operating systems (such as BSD systems, although this has not been tested).
Features of SciDAVis
- SciDAVis can create various types of 2D and 3D graphs (line graphs, scatter plots, 3D histograms, 3D pie histograms, 3D surfaces) based on data imported from ASCII files, entered manually, or calculated using formulas.
- Data is stored in separate spreadsheets, which contain data in columns (X and Y axes for 2D graphs) or as matrices (for 3D graphs).
Tables, graphs, and accompanying notes are collected into projects and can be organized using directories.
- SciDAVis’s built-in analysis tools include row/column table statistics, convolution/deconvolution, fast Fourier analysis, and fast Fourier-based data filters.
Data can be fitted using user-defined functions or a built-in set of linear and nonlinear fitting functions, including multi-peak fitting using the GNU General Scientific Library.
Plots can be saved in several raster graphic file formats, as well as PDF, EPS, or SVG.
Built-in mathematical expression calculation is supported, as is a Python scripting interface. The graphical user interface is built using the Qt library.
Download for free – SciDAVis – scientific data analysis and visualization>>